TESTING AND DEBUGGING
Overview
Proteus contains a huge number of debugging tools to help you fault find in both your hardware and your firmware. A complete walkthrough of these techniques is covered separately in the Proteus VSM tutorial which we strongly recommend you read. In this topic we will provide some summary instruction on common debugging techniques within the VSM Studio IDE.
When you run a simulation the window layout in VSM Studio changes from the editing layout to the debugging layout. This allows you to launch and view various debug windows, to set breakpoints and single step your code and to view and interact with Active Popups. It also disables the ability to edit your code, so if you want to make changes to your firmware you must first stop the simulation.
VSM Studio is not the only way to debug a Proteus simulation. Where the firmware is a large project built on vendor middleware you may prefer to keep it in the IDE that came with the silicon and drive the simulation from there instead. See Debugging from a Third Party IDE below.
Breakpoints
When a simulation is free running the source window and most of the debugging windows are disabled. This is because instructions are typically executing at a speed that would make viewing them impossible.
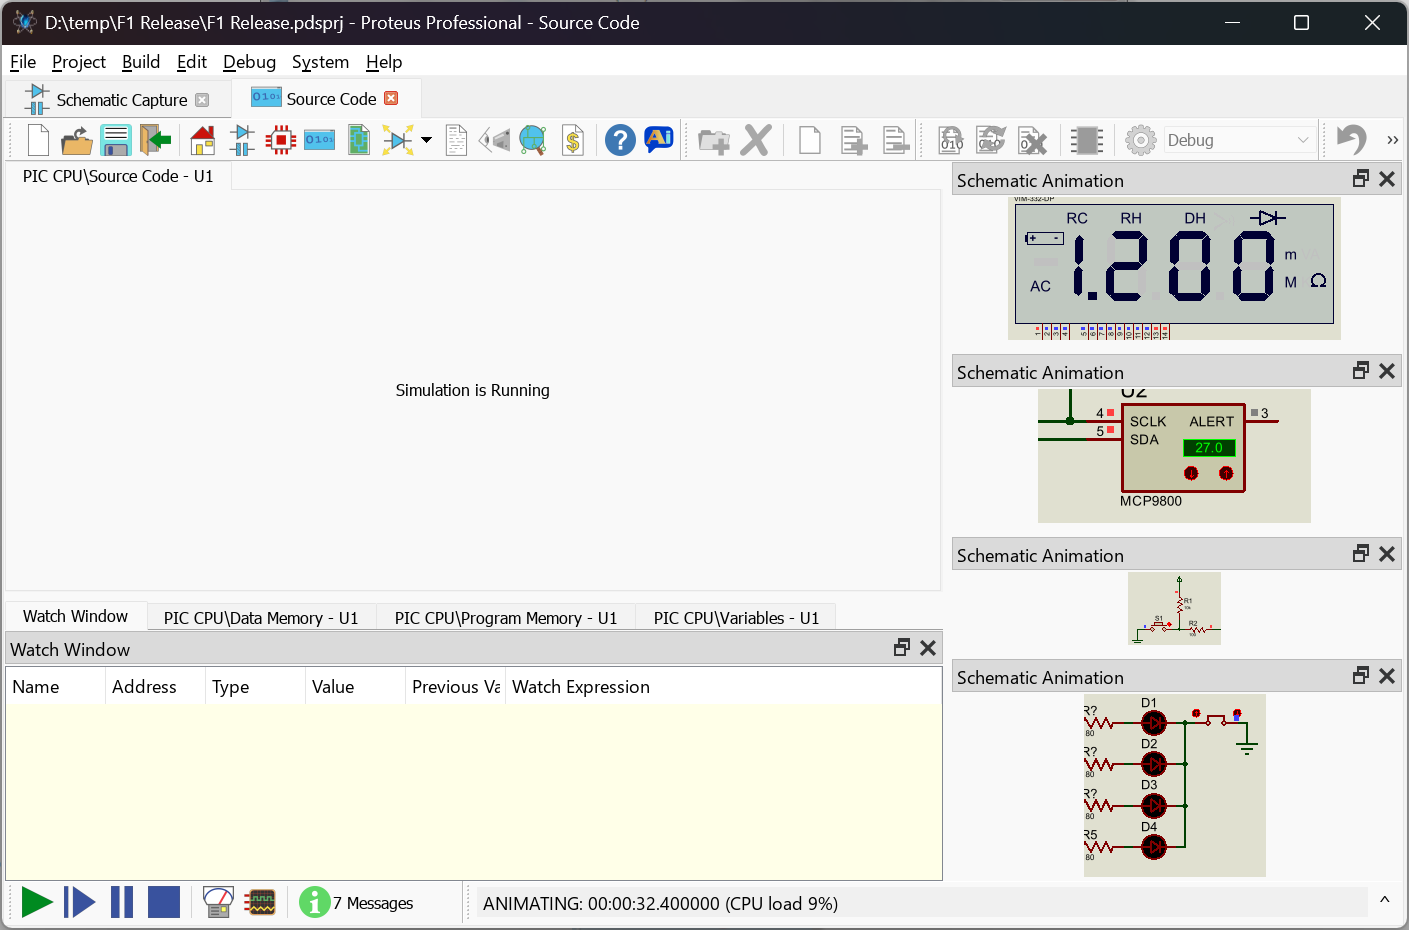
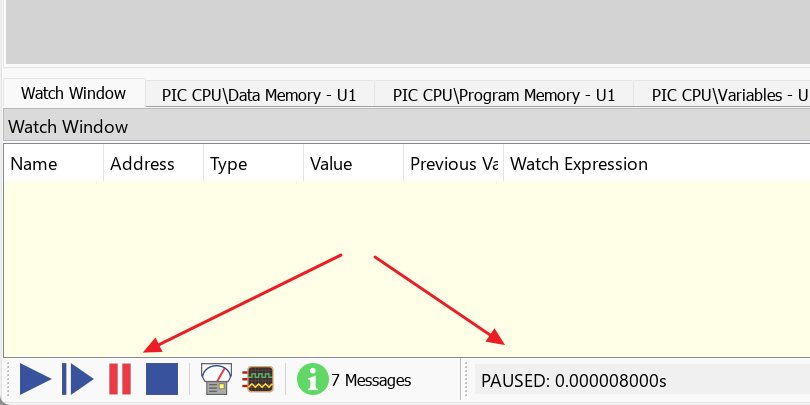
To view your source code you need to pause the simulation. You can do this at any time by pressing the pause button in the animation control panel.

This is actually a breakpoint but under direct user control: you typically have no idea what source code is executing when you hit the pause button. Far more useful is the ability to specify where in the source code you wish to pause.
Setting Breakpoints
There are two ways to set a breakpoint in VSM Studio. Firstly, this can be done at 'design time'. If you're writing your code and you know that you will want to pause the simulation at a certain point, simply left click next to the line number in the editor:
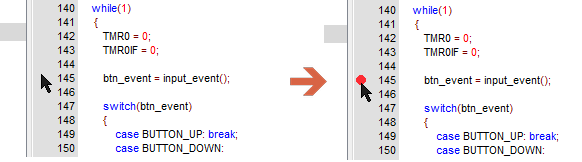
This will place a red dot indicating that a breakpoint is set. Then continue writing your program. During simulation the program will be paused at this point in the code.
Secondly, start the simulation with the pause button. This will pause at time zero (simulation 'booted' but no code executed).
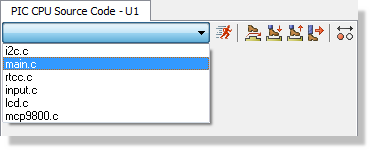
In VSM Studio select the relevant source file from the combo box at the top of the source window.
Find the source line you wish to set the breakpoint on and either left click on the left of the line number (as above), or left click on the line and then use the Toggle (Set/Clear) Breakpoint command, either from the context menu you get by right clicking on the line or with the F9 keyboard shortcut.
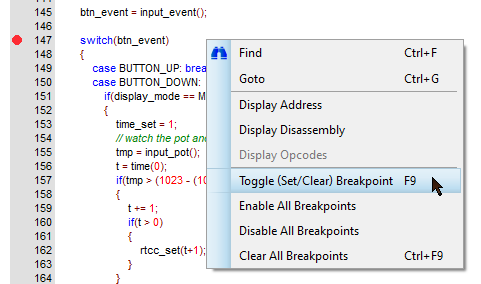
Now that the breakpoint is set, press the play button to run the simulation. The simulation will automatically stop just before it executes the line of code on which the breakpoint is set.

If setting a breakpoint in Disassembly, you need to left click on the far left of the line number, or right click on the line and use the context menu.
Controlling Breakpoints
There are several ways in which you can selectively or globally disable and clear breakpoints.
Individually, left clicking on a breakpoint will cycle through three states, so all of the actions described above for setting a breakpoint can be used to disable and to clear it as well. A filled red dot is set, an empty red circle is disabled, and no circle at all means there is no breakpoint on the line.
Globally, the source window context menu carries Enable All Breakpoints, Disable All Breakpoints and Clear All Breakpoints, which act on every breakpoint in the project. Clear All Breakpoints also has the CTRL+F9 keyboard shortcut. The same four breakpoint commands appear on the Edit menu.
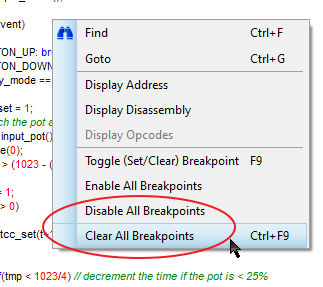
Disabling breakpoints keeps them in place, so Enable All Breakpoints puts the whole set back to work. Clearing them removes them altogether and they have to be set again.
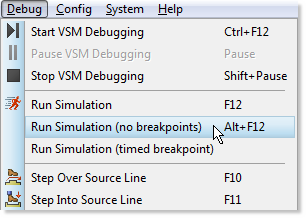
You can also start the simulation with the Run Simulation (no breakpoints) command on the Debug menu, or with its ALT+F12 keyboard shortcut. This runs the firmware with every breakpoint and every watchpoint suppressed for that run, without disturbing any of them.
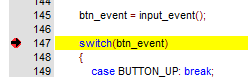
When the simulation hits a breakpoint it will pause, highlight the line and show a black arrow at the line of code where the breakpoint was hit:
The Breakpoints Window
Where a project has breakpoints scattered across several source files, the Breakpoints window collects them into one list. Open it with the Breakpoints command on the Edit menu or with the SHIFT+F9 keyboard shortcut; it is docked as a tab alongside the Output Window and is hidden until you ask for it.
Each row gives the state of the breakpoint, the source file and line it is set on, the program address and the project that owns it. Clicking the state column enables or disables a breakpoint, double clicking the file or address column opens the source at that line, and the DELETE key removes the selected breakpoint.
Watchpoints
A watchpoint is the data equivalent of a breakpoint. Rather than stopping the simulation at a place in the program, it stops the simulation when a value becomes what you are interested in, which is the quicker route to a fault that shows up as a bad number rather than as a wrong branch.
Watchpoints are set on items in the Watch Window. Add the value you want to follow to that window, then right click in it and choose Watchpoint Condition. The form there sets the test for each item, from a simple change of value through to a comparison against a value you supply, and decides whether the simulation stops when any condition is met or only when all of them are met at once.
Watchpoints are suppressed along with breakpoints by Run Simulation (no breakpoints).
See Also:
Single Stepping Code
Single stepping code works much like any other debugger. The commands can be actioned whenever the simulation is paused, from their icons on the source window, from the Debug menu or with their keyboard shortcuts.
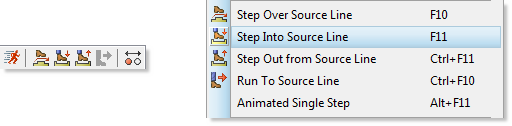
Five commands are provided:
- Step Over Source Line (F10) executes the current line and stops on the next one, running any function called from that line to completion without stopping inside it.
- Step Into Source Line (F11) executes the current line and stops on the first line of any function it calls.
- Step Out from Source Line (CTRL+F11) runs the rest of the current function and stops on the line that follows the call to it.
- Run To Source Line (CTRL+F10) executes until the current cursor position is reached. Put the cursor on the line you are interested in and the simulation runs at full speed until it gets there, which saves both a temporary breakpoint and a long sequence of single steps.
- Animated Single Step (ALT+F11) single steps repeatedly, so you can watch execution walk through the source and see the hardware respond as it goes.
If your program is written in a high level language like C you choose to single step either high level instructions or at assembly level. This happens automatically, based on what is visible on the source window. To view disassembly, and therefore to step assembler instructions, right click on the source window and select Display Disassembly from the resulting context menu.
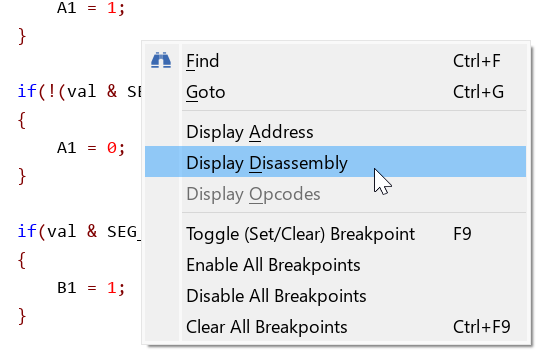
The same action will return the source, and therefore the step level, to the high level language.
You can only single step code when the simulation is paused, either by pressing the pause button or at a pre-defined breakpoint.
Debug Windows
Proteus includes a large number of debugging windows that can be used to help trace and find bugs. These include memory dumps, stack and register windows, the variables window, the Simulation Log, the Watch Window and the two system instruments, the System Scope and the System Meter.
All of these windows can be opened from the Debug menu and will appear as docked tabs at the bottom of VSM Studio. The System Scope and the System Meter can also be launched from the Scope and Multimeter buttons on the animation control panel.
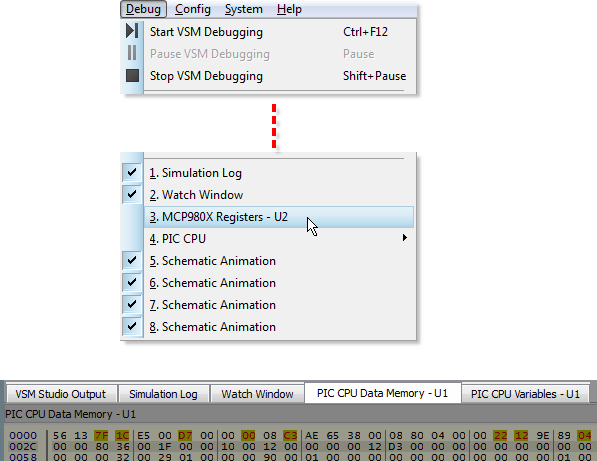
The memory, register, stack and variables windows do not refresh while the simulation is free running, because the processor is executing far too quickly for the display to be readable. They show you the state of the processor as soon as the simulation is paused or single stepped.
Several windows do work throughout a run. The Watch Window refreshes continuously, so it is the place to put the handful of values you want to follow at full speed. The Simulation Log accumulates messages as the models issue them. The System Scope and the System Meter display the signals they are probing as the simulation progresses, and their probes can be moved to other signal lines while the simulation is live.
Practical examples of using the Watch Window and other debug windows can be found in the Proteus VSM tutorial.
See Also:
The System Terminal
The System Terminal is a serial terminal hosted inside VSM Studio. It opens a COM port on your computer and gives you a console on it, showing whatever arrives on the port and sending whatever you type back out, which is how you exchange data with a simulated design that communicates over a serial connection.
Open it with the System Terminal command on the Debug menu. The window is docked at the bottom of the frame as a tab alongside the Output Window and is hidden until you ask for it.
The controls along the top of the window select the COM port, the data format and the baud rate, and an indicator to their right shows whether the connection is live. The same settings are also gathered on a form titled COM Settings, which you reach from the terminal's context menu and which offers the COM port, baud rate, word length, parity and stop bits. Either way the settings are stored with the project, so a design that always runs at a particular baud rate only needs setting up once.
The rest of the context menu controls the console itself. Line Mode collects what you type into a line buffer and sends it only when you press ENTER, which suits a target that expects whole commands; with Line Mode off, each keystroke goes out as you make it. Echo Typed Characters shows your own keystrokes in the display for targets that do not echo them back. Hex Display Mode shows the incoming bytes as hexadecimal rather than as text. Pause holds the display while you read it. Clear Screen, Copy, Paste, Set Font and Set Colours do what their names suggest.
The terminal acts on the control codes a target normally uses to drive a console, including carriage return, line feed, backspace and clear screen, together with the subset of VT100 escape sequences that target boards commonly send. It is not a full terminal emulator, so an application that paints an elaborate screen may not render exactly as it would in a dedicated terminal program.
Debugging from a Third Party IDE
VSM Studio is a convenience rather than a requirement. A large firmware project built on vendor middleware is often better kept in the IDE that came with the silicon, with Proteus serving purely as the target. Build the project in a GDB compatible IDE, STM32CubeIDE, Keil Studio, VS Code with the cortex-debug extension, Eclipse CDT or CLion for example, and then debug it against the live simulation: the IDE loads the firmware into the simulated processor, sets breakpoints and single steps the source exactly as it would against a board on the bench.
The switch that opens the door is Enable Remote Debug Monitor on the Debug menu. One click brings up both of the servers Proteus provides. The Virtual Debug Monitor serves the IDE specific drivers, and there is a driver for IAR Embedded Workbench, for the Keil uVision IDE, for MPLAB and for AVR Studio. Alongside it, the Cortex-M models expose a GDB Remote Serial Protocol server, which any GDB compatible front end can talk to.
Enable Remote Debug Monitor has to be turned on before a design is loaded. The command is only available while nothing is loaded, so if it is greyed out, close the design, set the option and open the design again.
Connecting a GDB Client
The GDB server listens on localhost, port 3333. Point the remote target of your IDE's GDB configuration at that address and start the debug session. The client loads the ELF file into the simulated target, starts the simulation and halts at your first breakpoint, and from there resume, suspend, stepping, registers, variables and memory all behave as they would against real hardware.
Two things are worth knowing before you configure a client. The GDB half of the monitor serves the Cortex-M models only, so the design must use a Cortex-M part. And the port number is read from the GDB Port registry value, so it can be moved if something else on the machine already owns 3333; setting that value to zero disables the GDB server altogether and leaves the Virtual Debug Monitor running on its own.
The GDB server binds to the loopback interface only, and it does so deliberately. A GDB client has unrestricted read and write access to the memory of the simulated target, so listening on every interface would offer that access to anyone on the network. Where a debugger genuinely has to reach Proteus from another machine, tunnel the connection over SSH rather than opening the server up.
See Also:
Debugging from an External IDE
Proteus VSM for IAR Embedded Workbench
Proteus VSM for the Keil uVision IDE
Active Popups
Active popups allow you to choose areas of the schematic that you want to see or interact with while you are debugging your code. In turn, this avoids a constant switch between schematic tab and VSM Studio tab during debugging, essentially bringing the relevant hardware into the software debugging environment.
A simple example of defining an active popup can be found in the VSM Studio new project tutorial, while more detailed coverage is available in the main Proteus VSM tutorial
Notes:
- You can only define active popups on the schematic when the simulation is stopped.
- As with other debugging windows, active popup windows can be closed in VSM Studio using the cross at the top right of their window. After closing, they can be re-opened from the Debug menu.
- When you have Active Popups defined on the schematic and open in VSM Studio, Proteus will auto-switch to the VSM Studio tab when you start a simulation. It is assumed that your session will primarily take place in the debugging environment.
- When there are no active popups defined on the schematic or if you have closed their windows in VSM Studio, Proteus will auto-switch to the schematic tab when you start a simulation.
- In either case, Proteus will auto-switch to the VSM Studio tab when a simulation is paused in order to display the source code.
The Debug Menu
The Debug menu carries the commands that start, run and step a simulation, together with the housekeeping commands for the debug windows. It is the same menu on the schematic and in VSM Studio.
| Command | Shortcut | Purpose |
| Start VSM Debugging | CTRL+F12 | Start the simulation and switch to the debugging layout. |
| Pause VSM Debugging | PAUSE | Pause the simulation, or start it up at time zero if it is stopped. |
| Stop VSM Debugging | SHIFT+PAUSE | Stop the simulation and return to the editing layout. |
| Run Simulation | F12 | Run the simulation from the current point. |
| Run Simulation (no breakpoints) | ALT+F12 | Run the simulation with breakpoints and watchpoints suppressed. |
| Run Simulation (timed breakpoint) | Run the simulation for a specified time interval and then pause. | |
| Step Over Source Line | F10 | Step over the current function or subroutine. |
| Step Into Source Line | F11 | Step into the current function or subroutine. |
| Step Out from Source Line | CTRL+F11 | Step out of the current function or subroutine. |
| Run To Source Line | CTRL+F10 | Execute until the current cursor position is reached. |
| Animated Single Step | ALT+F11 | Single step repeatedly. |
| Reset Debug Popup Windows | Restore the default colours and positions of the popup windows. | |
| Reset Persistent Model Data | Reset the persistent model data to its default values. | |
| Configure Diagnostics | Choose what the models record in the Simulation Log. | |
| Enable Remote Debug Monitor | Enable debugging of the simulation from an external IDE. | |
| System Terminal | Show the system debug terminal. |
Beneath these commands the menu lists the debug windows available for the current simulation, numbered so that each can be opened from the keyboard. The list is built when the simulation starts and reflects the processors and the active popups on your schematic, so it differs from one design to the next.
Configure Diagnostics decides how much detail the models write to the Simulation Log. Raising the level on a peripheral you are investigating tells you what the model thinks it is being asked to do, which is often quicker than reading registers.
Reset Persistent Model Data clears the data that models such as EEPROM and flash memory carry from one simulation run to the next, returning them to the state they were in before the firmware first wrote to them.
See Also: